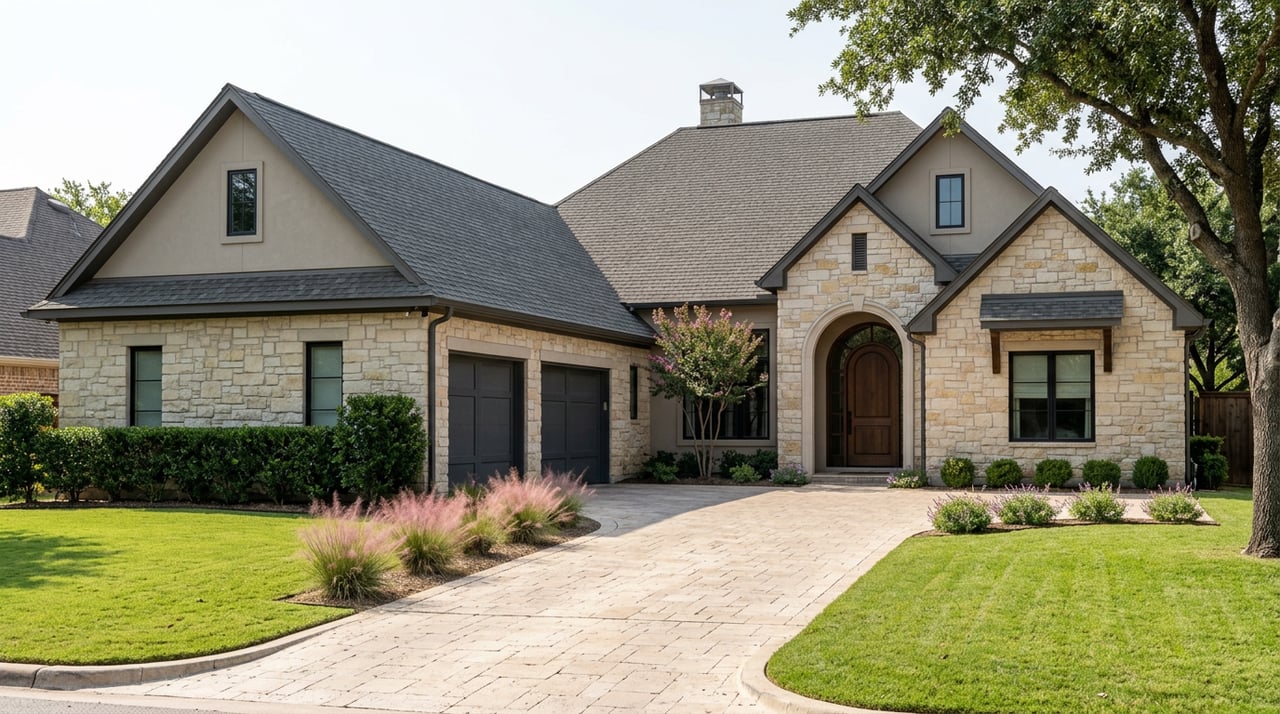
Two homes list in Rockwall on the same week, both priced in the mid-$500,000s. One goes under contract before the first open house even happens. The other is still sitting there five months later, with a price cut and a second price cut, and a seller wondering what went wrong. Same city, same general price band, wildly different outcomes. If you've been watching the Rockwall market from the outside, that gap is the part nobody's median price tells you about.
The headline number for Rockwall over the twelve months ending in mid-July 2026 was 966 closed sales, a median price of $530,000, and a citywide median of 59 days on market, with 10.7% of homes selling over asking. That's the figure that shows up on every portal search and every market update email. It's accurate. It's also a citywide figure that can obscure differences among subdivisions that don't behave anything alike, and once you break the city into its actual neighborhoods, the pattern that emerges isn't the one most buyers expect.
The Number Everyone Quotes Isn't the Number That Applies to Your Street
Here's the citywide breakdown by subdivision, using the same twelve-month window of closed NTREIS sales:
| Subdivision | Closed Sales | Median Price | Median Days on Market |
|---|---|---|---|
| Terraces | 84 | $656,345 | 95 |
| Somerset Park | 36 | $712,122 | 98 |
| The Homestead | 31 | $641,000 | 50 |
| Saddle Star Estates | 29 | $744,000 | 85 |
| Nelson Lake | 19 | $601,600 | 99 |
| Terracina Estates | 15 | $585,000 | 162 |
| Park Hills | 12 | $540,000 | 72 |
| Promenade Harbor | 12 | $395,000 | 59 |
| Breezy Hill | 11 | $802,557 | 120 |
| The Shores | 11 | $445,000 | 22 |
Look at the two extremes. The Shores, a golf-course community on the lower end of this price range at $445,000, cleared in 22 days, the fastest of any subdivision on the list. Terracina Estates, priced lower than six of the other nine neighborhoods at $585,000, took 162 days, the slowest of any subdivision on the list. If price alone explained speed, that relationship would run in reverse.
It doesn't hold up anywhere else on the table either. Breezy Hill, the most expensive pocket at $802,557, took 120 days. Saddle Star Estates, the second most expensive at $744,000, moved faster at 85 days. The Homestead, priced in the middle of the pack at $641,000, sold in 50 days, faster than four cheaper subdivisions on this list. Plot median price against days on market for these ten neighborhoods and you won't find a line. You'll find scatter.
Why Price Tier Doesn't Explain the Wait
The instinct is to reach for a story about luxury buyers being pickier, or entry-level buyers moving faster because there are more of them. Neither story survives contact with this table. What does explain it is something less flattering to the whole idea of a tidy market narrative: most of these subdivisions barely have enough annual sales to produce a stable median in the first place.
Look at the sales counts next to the days-on-market figures. The Shores closed 11 sales in twelve months. Breezy Hill closed 11 sales. Terracina Estates closed 15. Promenade Harbor closed 12. These are not large samples. When a neighborhood only produces a dozen closings a year, an unusually slow or fast sale can have an outsized effect on its median days-on-market figure, though the median still reflects the middle sale rather than a single listing.
Terraces and Somerset Park are the two subdivisions on this list with real volume, 84 and 36 sales respectively, and their days-on-market figures, 95 and 98, sit close together and close to what you'd expect from a market with genuine seller-side data behind it. The smaller subdivisions don't have that luxury. Their medians can be less stable than the citywide statistic.
This matters more in Texas than it would in a disclosure state, because Texas doesn't require sale prices to be recorded publicly. Buyers and sellers here don't get to look up what the house down the street actually closed for the way they could in a state with public transfer records. Aggregated broker data like this is often the closest thing to visibility a buyer has, and a thin sample dressed up as a subdivision median can be read with more confidence than it deserves.
What Pricing Discipline Actually Costs (Or Saves)
There's a second layer to this that ties the DOM story directly to money changing hands. Sellers across Rockwall who held their original list price closed in 16 days at 98.6% of that asking price. Sellers who started high and cut later took 99 days and closed at 90.2% of their original ask, a gap that works out to roughly $48,300 left on the table for a typical Rockwall listing.
Put that next to the subdivision table and the story sharpens. A neighborhood with a 162-day median like Terracina Estates isn't necessarily a soft market for every home in it. Well-priced homes may have moved in a fraction of that time. If you're selling into a neighborhood with a small annual sales count, the citywide DOM figure tells you almost nothing about how your specific home will perform. Your own pricing decision, made on day one, does far more work than the subdivision's recent history.
What This Means Depending on Which Side of the Table You're On
If you're buying in a subdivision like The Shores or The Homestead, where homes have been moving in three to seven weeks, treat the listing you like as a live decision, not a browsing exercise. At those paces, inventory doesn't sit around waiting for you to come back from a weekend trip.
If you're eyeing something in Terracina Estates, Somerset Park, or Breezy Hill, where some recent medians stretch past three months, don't assume that number describes every home in the neighborhood equally. Ask your agent to pull the individual listing history, not just the subdivision median, before you decide how much negotiating room you actually have. A few stale listings may shape the overall picture, but that doesn't necessarily mean buyers are indifferent toward the street.
And if you're selling anywhere in Rockwall, the 16-day, 98.6%-of-ask outcome versus the 99-day, 90.2%-of-ask outcome isn't a coin flip. It's a function of where you set the number on day one, in a market where a slow neighborhood median can just as easily be hiding a pricing mistake as reflecting real softness.
A Few Common Questions
Is Rockwall a buyer's market or a seller's market right now? Neither cleanly. Inventory has grown and days on market have lengthened compared to the peak years, which gives buyers more room to negotiate on homes that are overpriced or need work. At the same time, well-priced homes in the right subdivision are still closing in a matter of weeks. The honest answer depends on which of the ten subdivisions above you're actually shopping in.
Why does a subdivision's median days on market swing so much year to year? Small sales counts. Most of Rockwall's named subdivisions close somewhere between 11 and 36 homes a year. A market with that little volume doesn't produce a stable statistical median the way a subdivision with hundreds of annual closings would. One unusually slow sale can shift the whole picture.
How do I find out if a slow-selling subdivision is actually a soft market or just one stuck listing? Ask for the individual sale history, not just the subdivision median. With a handful of annual closings, the median days-on-market figure may not capture how differently individual homes performed.
Rockwall's citywide numbers are a real and useful starting point, but they can obscure differences among ten subdivisions that each run on their own clock. If you want to know what your specific street is actually doing right now, not what the whole city did on average last year, Rosie Carrasco Cox has spent 21 years watching these neighborhoods sell one house at a time. Schedule a free consultation and get the numbers for the street you're actually considering, not just the city it sits in.
This article is general information, not legal, tax or financial advice. Consult a qualified professional about your situation.